
GrowInsights360 – Dashboard
GrowInsights360 – Dashboard
- Product Description
GrowInsights360 is an advanced analytics dashboard that lets you securely connect your GA4 account through Google OAuth and monitor your website performance with a wide range of metrics across multiple dimensions.
Step 1: Connect your Google Analytics
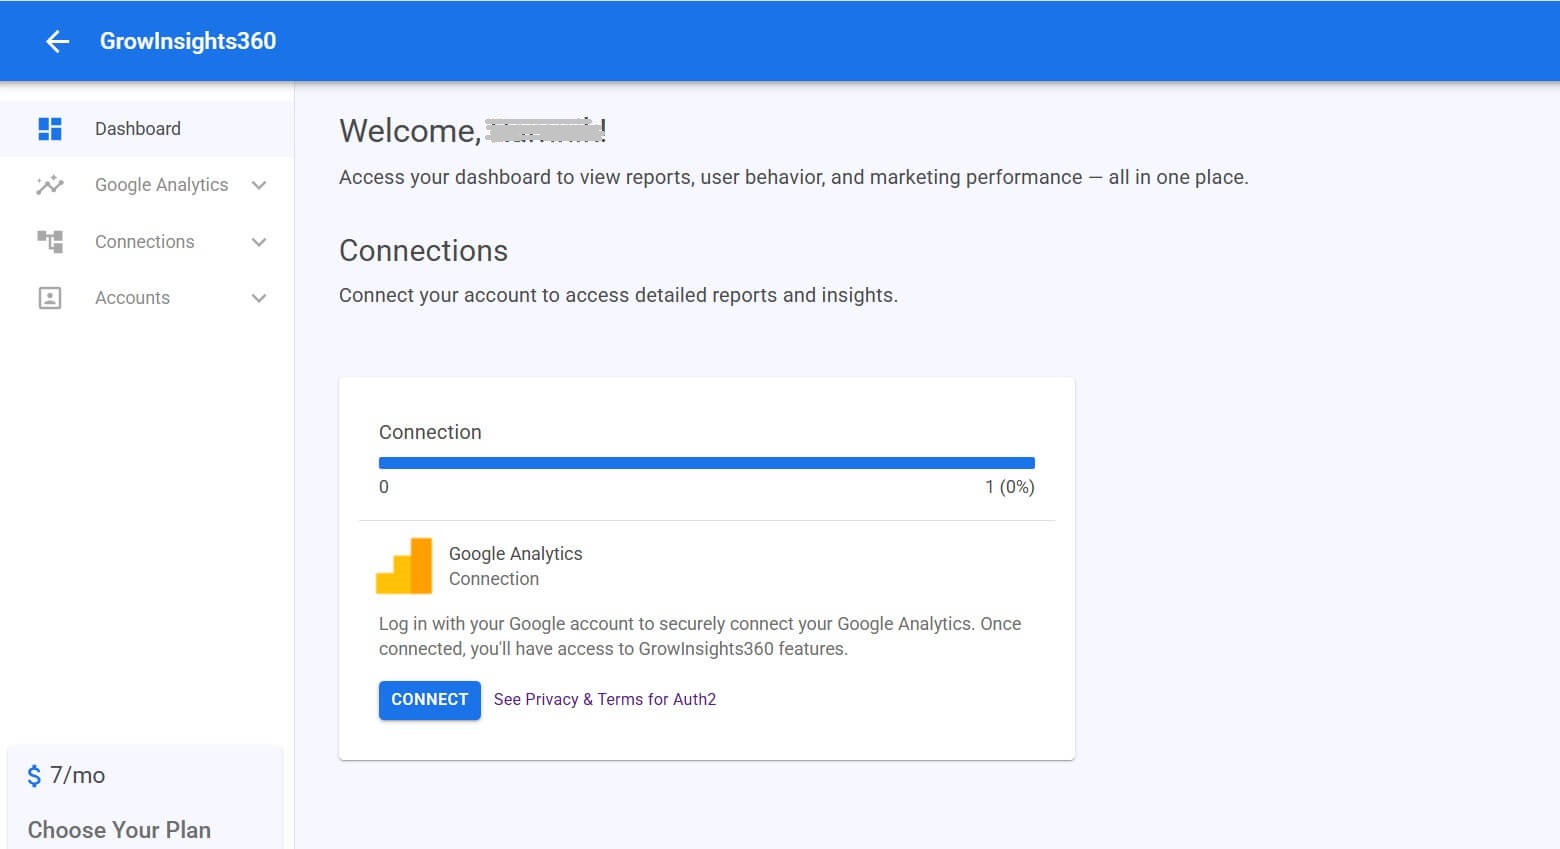
Click on the “Connect” button inside your GrowInsights360 dashboard. This will begin the secure OAuth2 connection process with Google.
Step 2: Sign in with Google and Grant Permissions
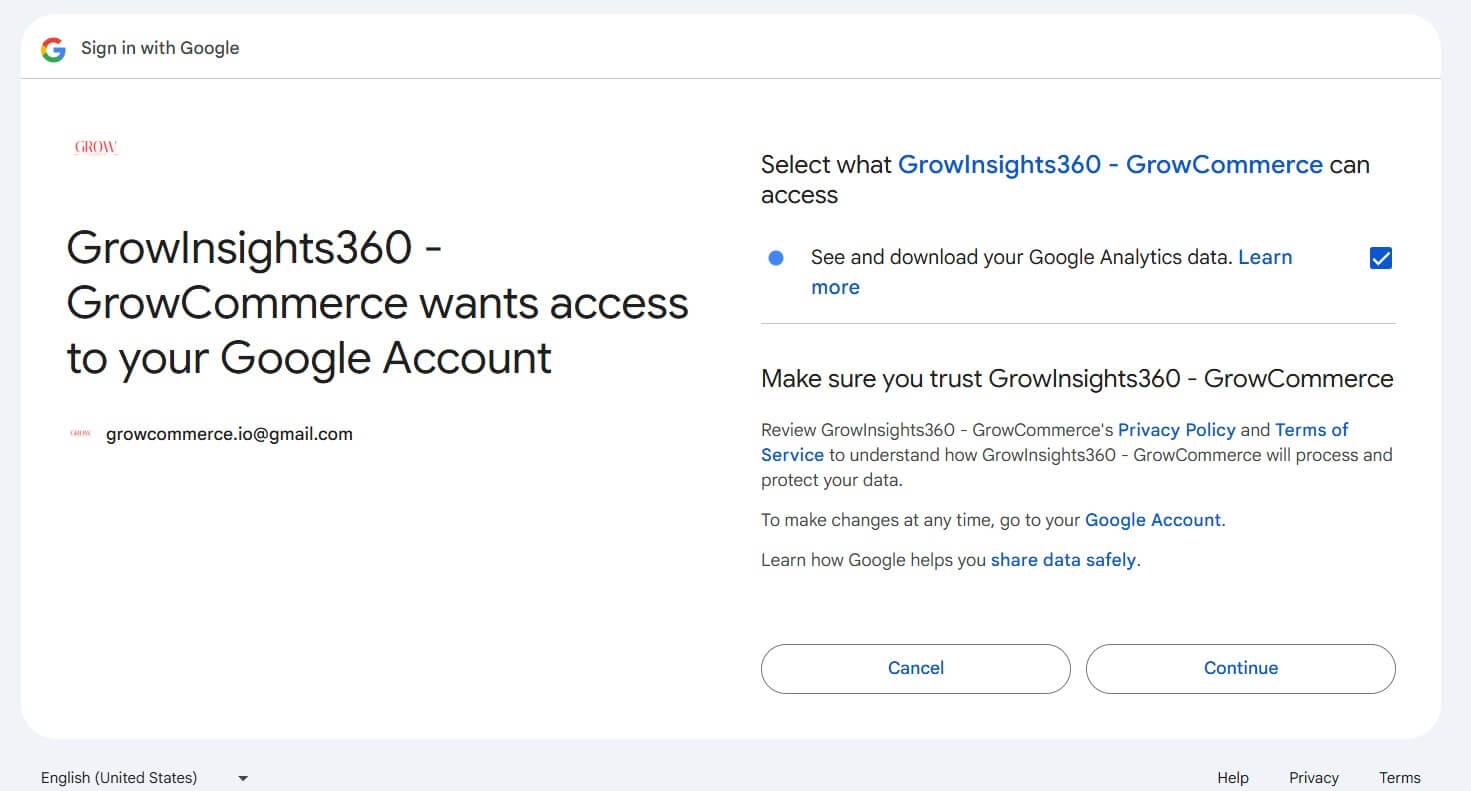
You will be redirected to a Google sign-in page. Select the Google account that has access to your GA4 properties. Google will ask for permission to share your read GA4 data with GrowInsights360. Click “Allow” to proceed.
Step 3: Create a Connection Name
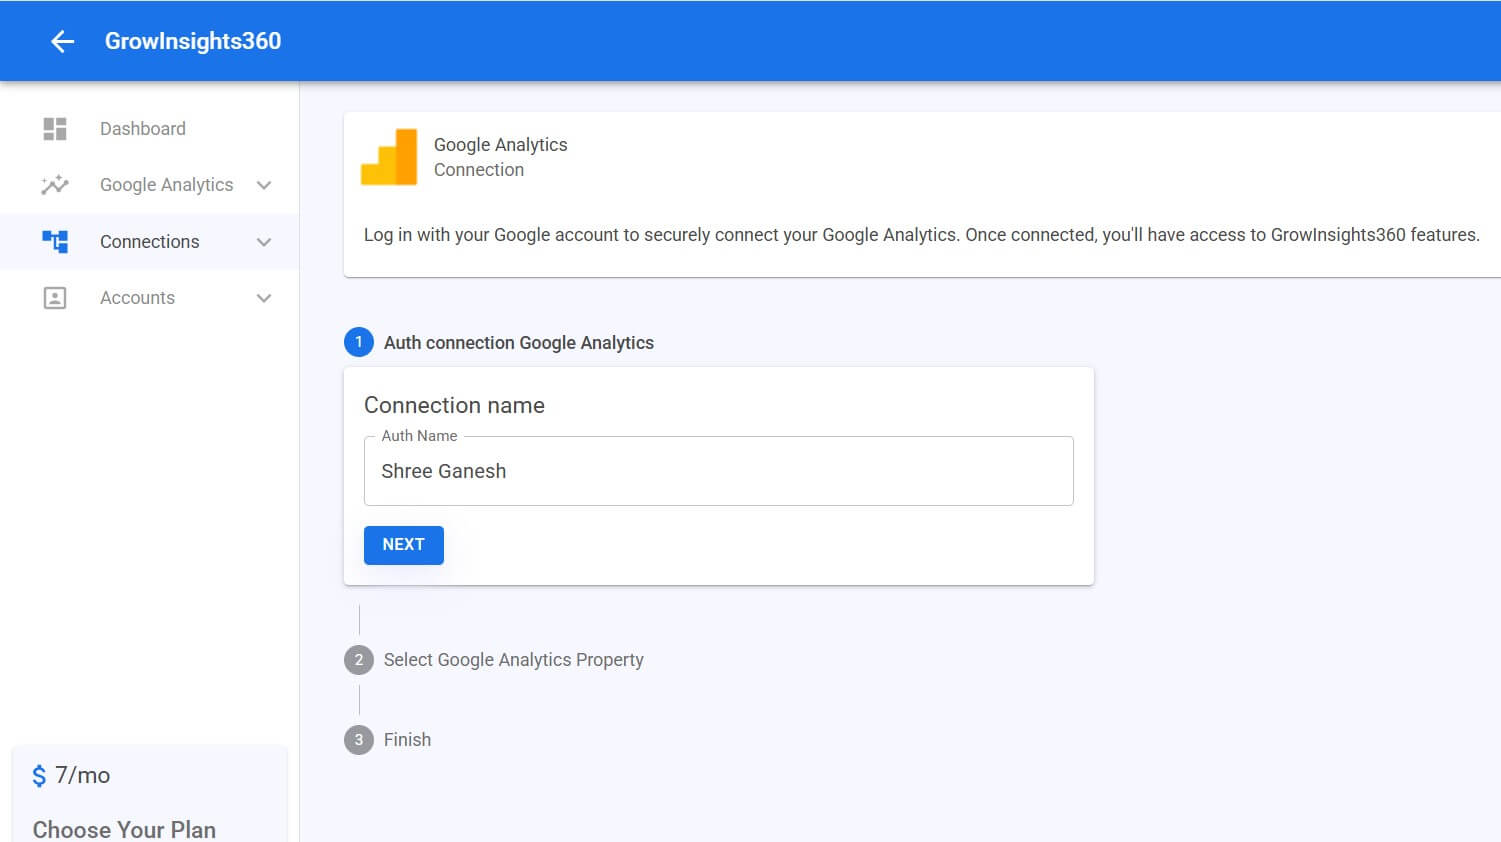
Enter a unique connection name so you can easily identify this GA4 integration later. Example: “Main Store Analytics”.
Step 4: Select GA4 Account and Property
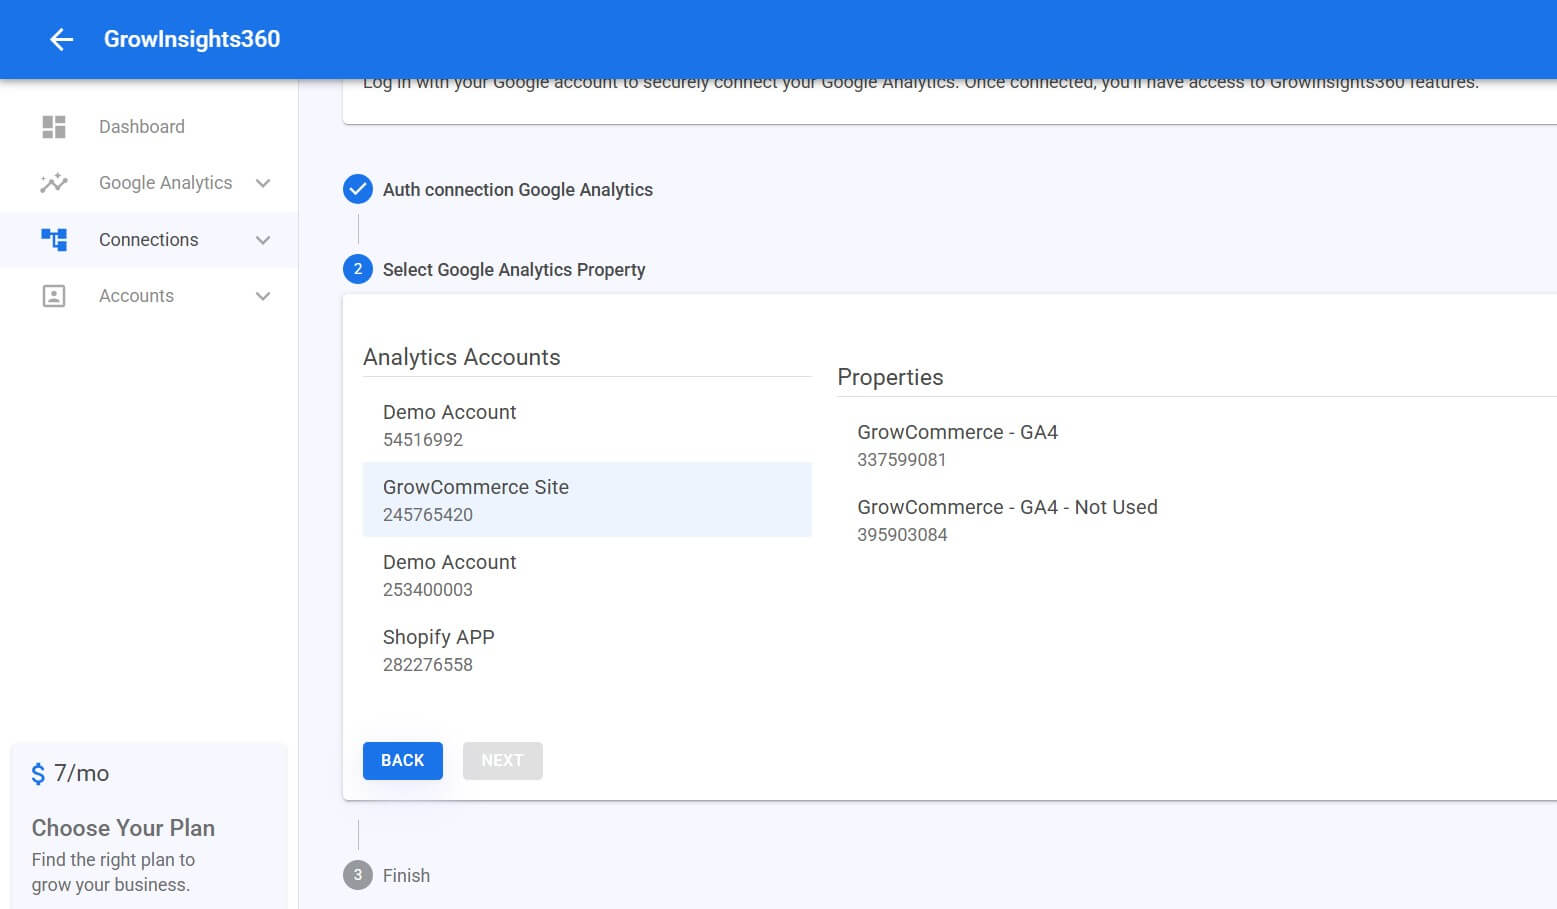
Choose the GA4 account and from the list of available properties, select the GA4 property that contains your website or app data.
Step 5: Confirm & Save
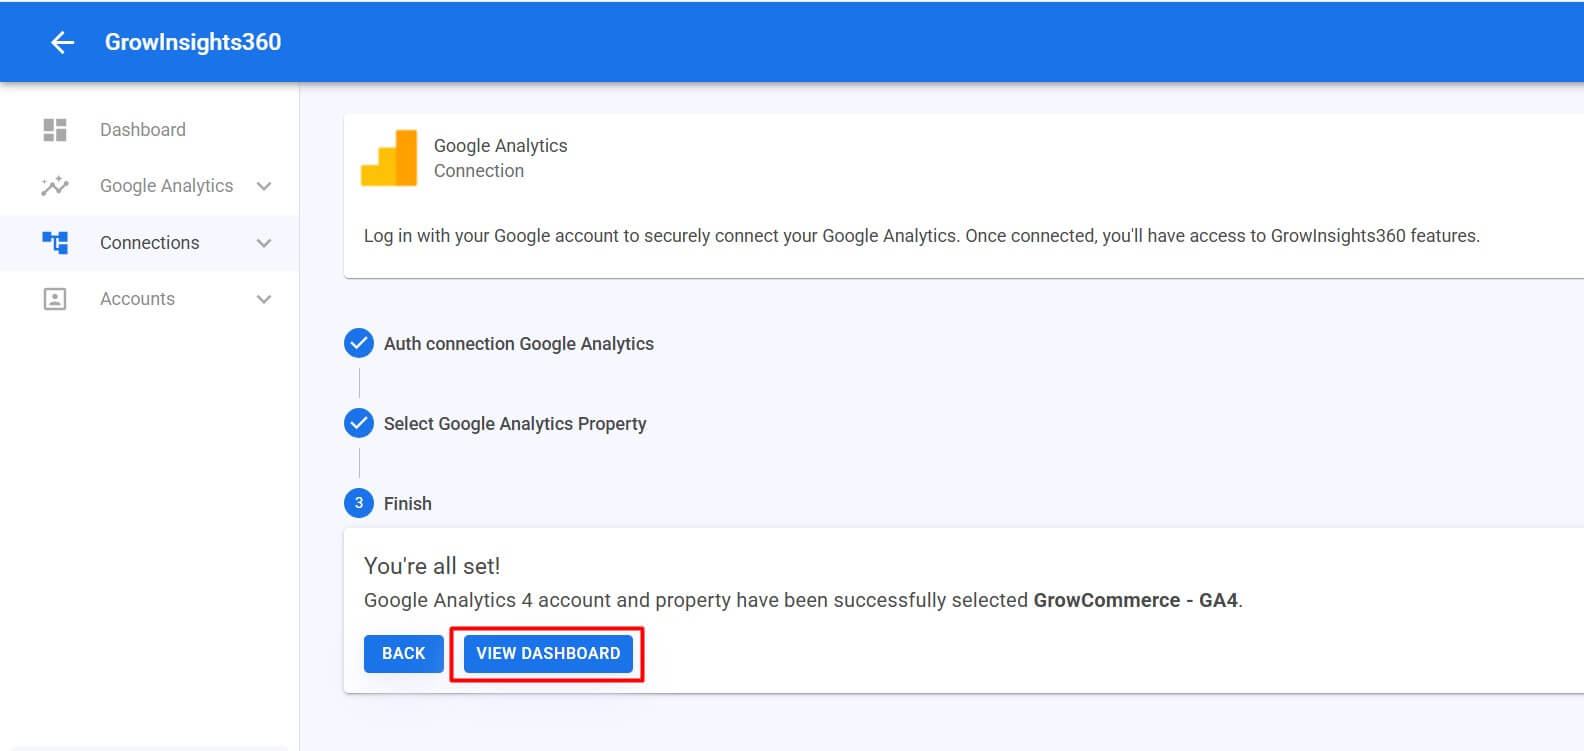
Click “View Dashboard” to finalize the setup and open your GA4 reports.
Google Analytics Reports
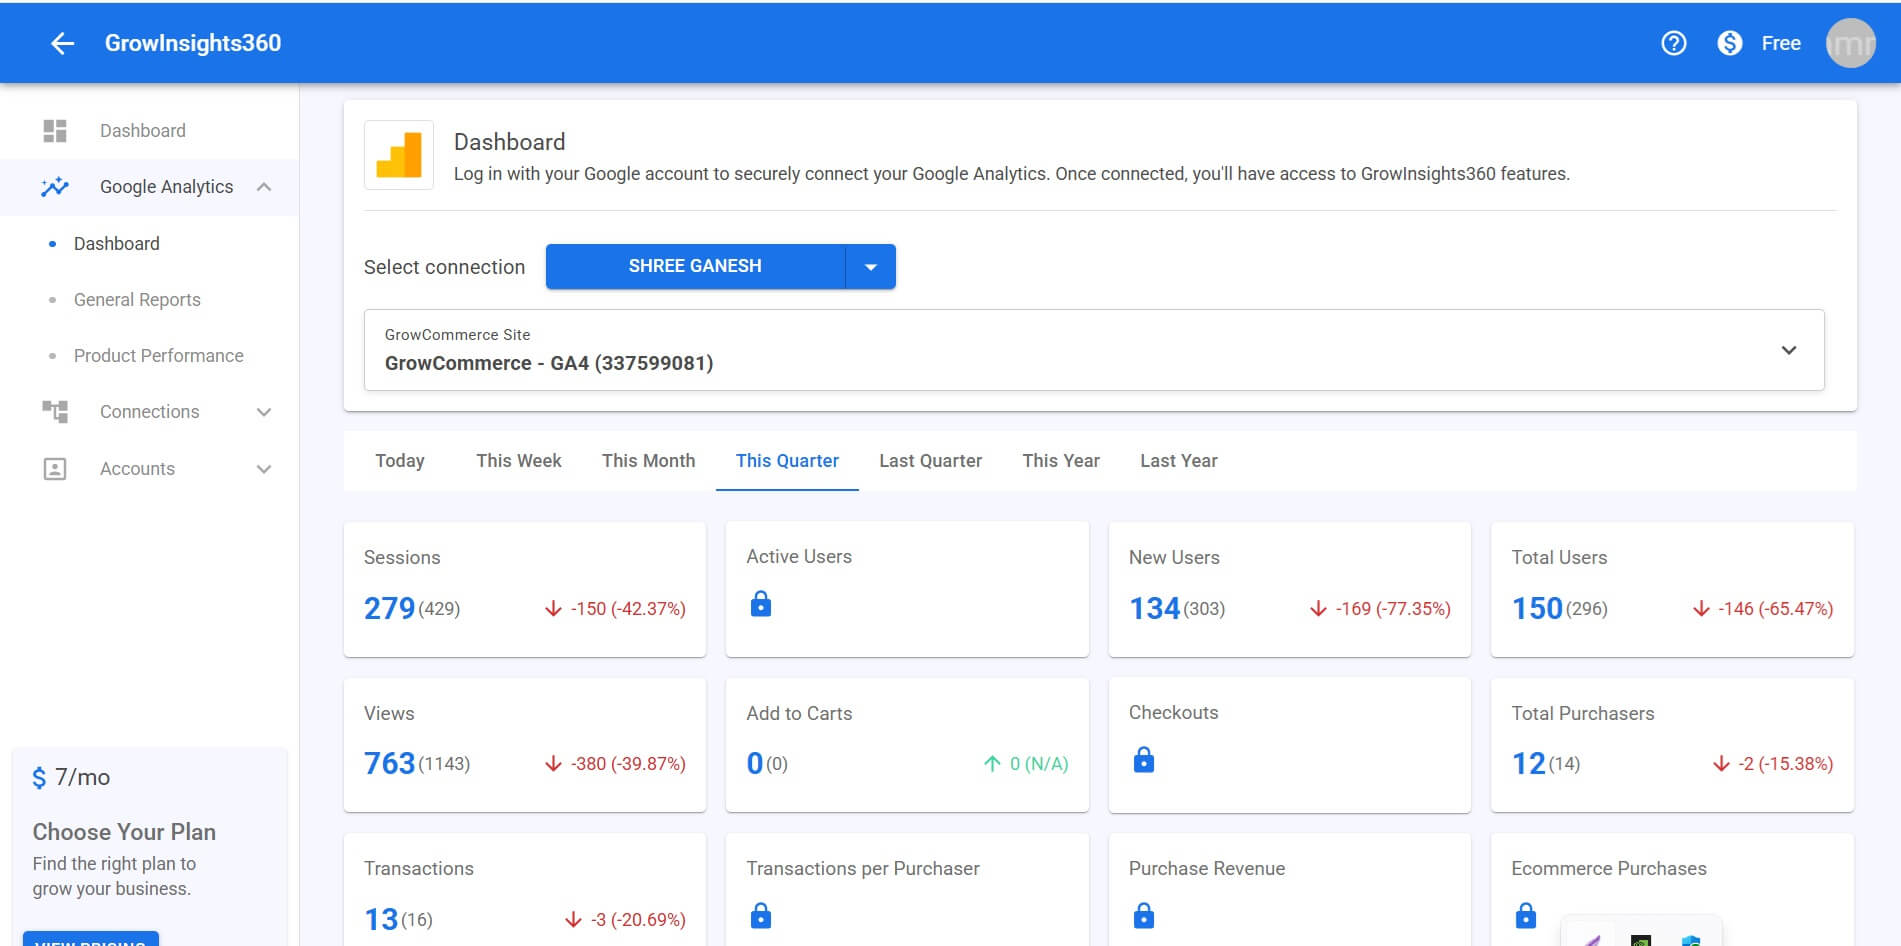
1. GrowInsights360 – Google Analytics Dashboard Overview
GrowInsights360 gives you clear, easy-to-understand access to your Google Analytics 4 (GA4) data through a centralized reporting dashboard. Whether you’re tracking user behavior or ecommerce performance, GrowInsights360 helps you stay on top of the metrics that matter—without the complexity.
Time-Based Performance Filters
Easily analyze and compare performance using flexible time ranges:
- Today, This Week, This Month, This Quarter, Last Quarter, This Year, and Last Year
These options help you understand trends and measure progress over time.
Traffic and User Insights
Understand how users interact with your website through key traffic metrics. Track total visits, identify new and returning users, and monitor overall page engagement.
Ecommerce Engagement Metrics
Measure how users move through your sales funnel. See how often products are added to carts and track checkout activity and completed purchases.
Transaction & Revenue Metrics
Evaluate your store’s sales performance. Monitor total transactions, identify unique purchasers, and measure customer buying behavior and revenue.
Performance Comparison Indicators
Each metric includes a built-in comparison to previous periods, with clear percentage changes and visual arrows to highlight performance trends at a glance.
2. General Reports – GrowInsights360
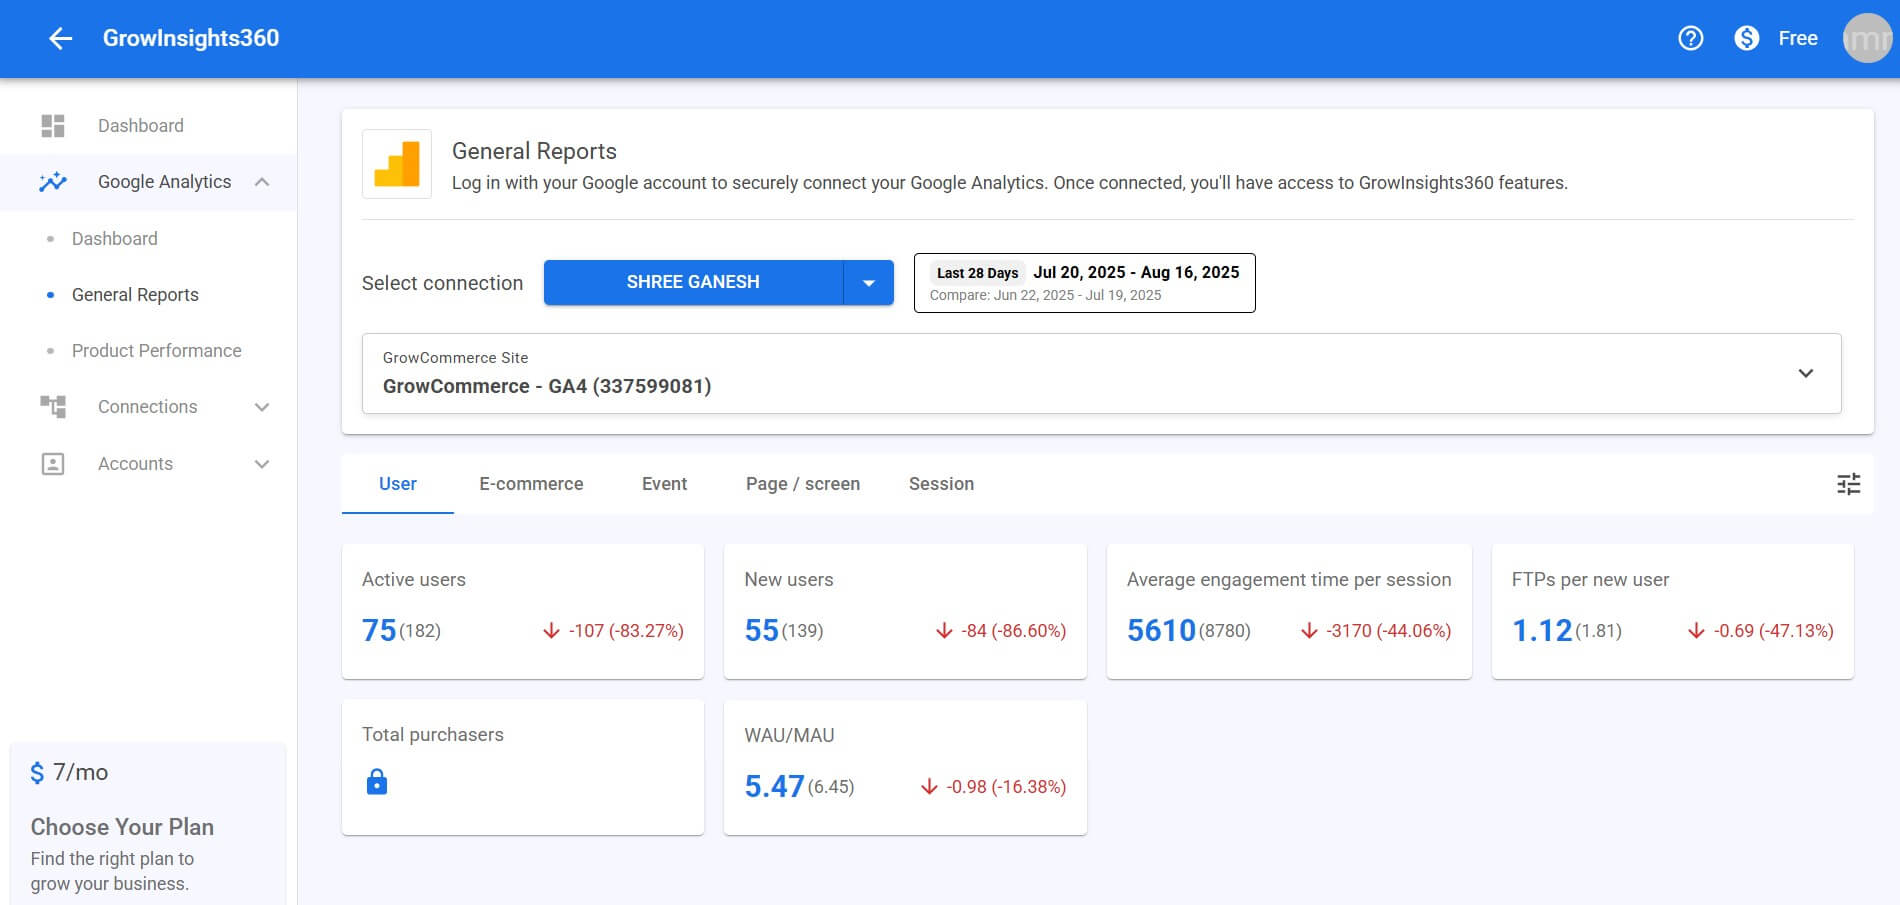
The General Reports section in GrowInsights360 provides a high-level summary of key user and engagement metrics over a selected date range. This helps you understand user growth, behavior, and site performance trends using data pulled from Google Analytics 4 (GA4).
3. Product Performance – GrowInsights360
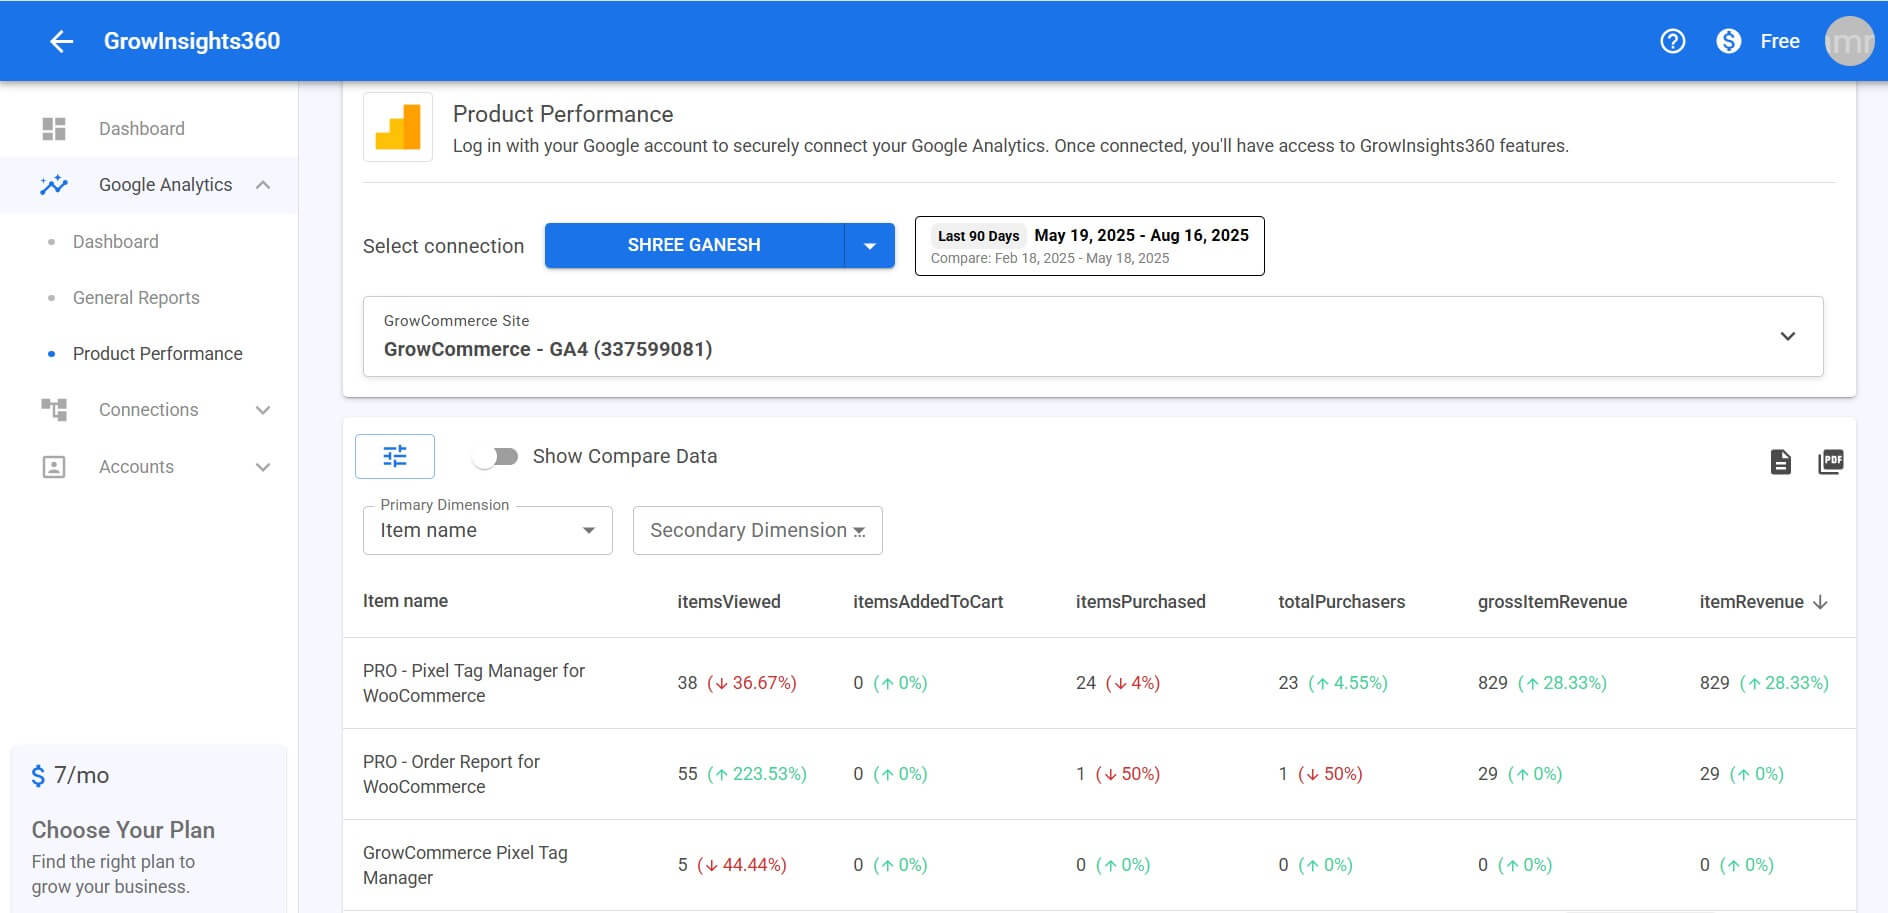
The Product Performance report in GrowInsights360 gives you detailed insights into how individual products are performing on your ecommerce site. By pulling data directly from Google Analytics 4 (GA4), it helps you evaluate product visibility, engagement, sales, and revenue over a selected date range.
🧭 Understanding Dimensions in Product Performance
🔹 Primary Dimension
The Primary Dimension controls how your product data is grouped in the Product Performance report. Available options:
- Item Name – View performance per product name.
- Item ID – Track metrics by the unique product ID.
- Item Category – Group products by category (e.g., electronics, apparel).
- Item Brand – Segment product performance by brand.
Use this to analyze how individual products, categories, or brands perform across views, carts, purchases, and revenue.
🔸 Secondary Dimension (Optional)
The Secondary Dimension adds another layer of breakdown to your primary data. This lets you explore deeper insights by combining dimensions:
- Country – Discover where your traffic or sales originate.
- Device Category – Compare performance across devices (mobile, desktop, tablet).
- Region – Drill down by states, provinces, or other sub-regions.
Secondary dimensions help uncover location-based and device-based trends in your product performance.
📈 Example Use Cases
- Compare Item Name + Country to see top products per region.
- Use Item Category + Device Category to analyze product type performance across devices.
🔍 Comparison Features
Compare Data Toggle: Easily compare performance across two different date ranges.
Percentage Change: Each metric includes percentage change from the previous period.
Color Indicators:
- 📉 Red = performance drop
- 📈 Green = improvement or growth
4. Purchase Journey – GrowInsights360
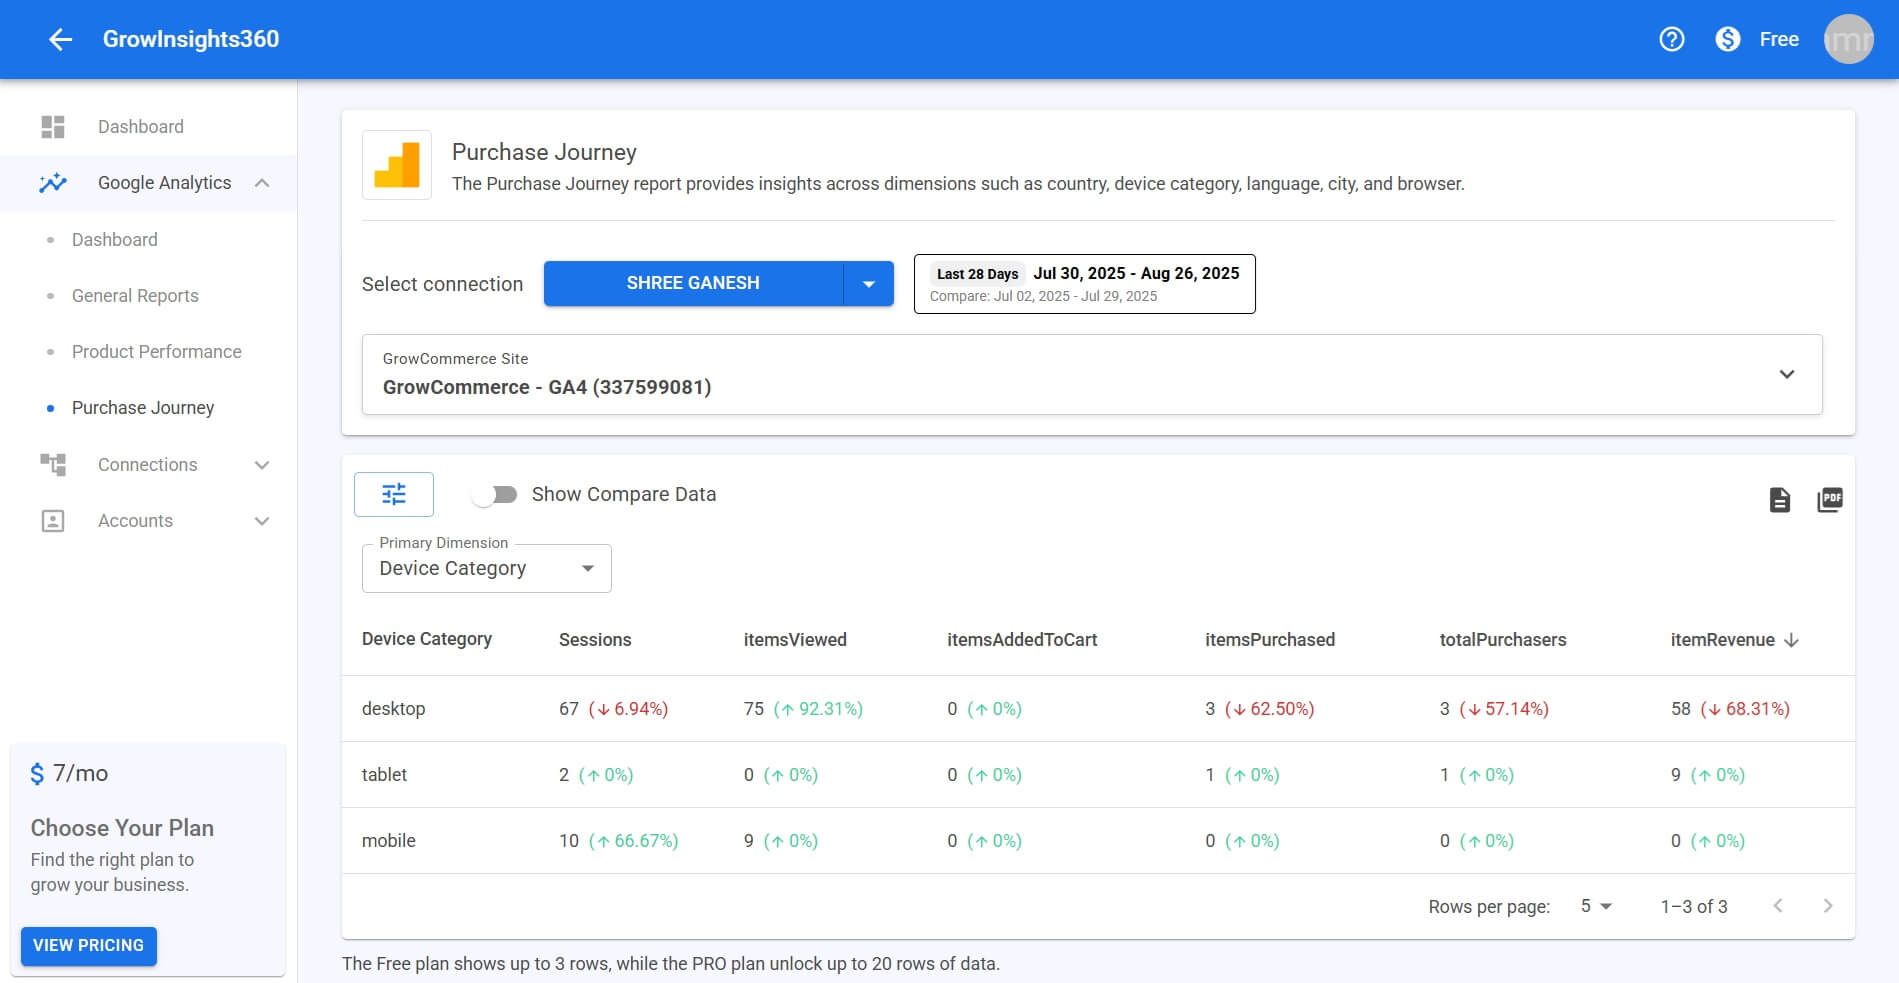
The Purchase Journey report provides detailed insights into how users move from browsing products
to completing a purchase. Analyze key metrics to identify drop-offs and optimize your funnel.
What You Can See
Track performance using metrics like Sessions, Items Viewed,
Items Added to Cart, Items Purchased,
Total Purchasers, and Item Revenue.
Segment By
- Device Category (desktop, mobile, tablet)
- Country
- Region
- City
- Language
- Browser
- Item Name
Why It Matters
- Compare performance across devices, locations, and user attributes.
- Understand purchase behavior and product performance.
- Identify drop-off points to improve conversions and revenue.
Data Limits: The Free plan shows up to 3 rows of data, while the Pro plan unlocks up to
20 rows for deeper analysis.